linux perf
2015-10-27
linux perf 介绍
Perf 是用来进行软件性能分析的工具。
通过它,应用程序可以利用 PMU,tracepoint 和内核中的特殊计数器来进行性能统计。它不但可以分析指定应用程序的性能问题 (per thread),也可以用来分析内核的性能问题, 当然也可以同时分析应用代码和内核,从而全面理解应用程序中的性能瓶颈。
最初的时候,它叫做 Performance counter,在 2.6.31 中第一次亮相。此后他成为内核开发最为活跃的一个领域。在 2.6.32 中它正式改名为 Performance Event, 因为 perf 已不再仅仅作为 PMU 的抽象,而是能够处理所有的性能相关的事件。
perf 事件的分类:
- software events:是纯粹的 kernel 计数器事件,如:context-switches, minor-faults
- hardware events/hardware cache events:是基于 Performance Monitoring Unit (PMU) 处理器自身的事件。
- tracepoint events:是通过内核 ftrace 架构实现的事件,这种事件 kernel 必须 >= 2.6.3x。
linux perf 使用
linux perf 主要有两种使用方式:
- counting events:这种模式工作在 kernel 上下文中,当事件发生时,perf 会打印出来,这种模式下不会产生 perf.data 文件。
- sampling events:中模式下,kernel 会将事件的数据记录在 kernel buffer 中,然后异步写入 perf.data 文件中,最后可以通过 perf report or perf script 来读取和解释这个文件。
counting events 模式的主要命令为 perf stat,sampling events 模式的主要命令为 perf record。
有用的命令收集
Listing Events
# Listing all currently known events:
perf list

# Listing sched tracepoints:
perf list 'sched:*'

[root@docker221 ~]# perf list

List of pre-defined events (to be used in -e):
  cpu-clock                                          [Software event]
  task-clock                                         [Software event]
  page-faults OR faults                              [Software event]
  context-switches OR cs                             [Software event]
  cpu-migrations OR migrations                       [Software event]
  minor-faults                                       [Software event]
  major-faults                                       [Software event]
  alignment-faults                                   [Software event]
  emulation-faults                                   [Software event]
  dummy                                              [Software event]

  power/energy-cores/                                [Kernel PMU event]
  power/energy-pkg/                                  [Kernel PMU event]
  power/energy-ram/                                  [Kernel PMU event]

  rNNN                                               [Raw hardware event descriptor]
  cpu/t1=v1[,t2=v2,t3 ...]/modifier                  [Raw hardware event descriptor]
   (see 'man perf-list' on how to encode it)

  mem:<addr>[:access]                                [Hardware breakpoint]

  ext4:ext4_free_inode                               [Tracepoint event]
  ext4:ext4_request_inode                            [Tracepoint event]
  ext4:ext4_allocate_inode                           [Tracepoint event]
  ext4:ext4_evict_inode                              [Tracepoint event]
  ext4:ext4_drop_inode                               [Tracepoint event]
  ext4:ext4_mark_inode_dirty                         [Tracepoint event]
  ... ...
可以看到 perf 可以的跟踪的事件的类型很多,我们可以使用下面的命令来统计下情况:
[root@docker221 ~]# perf list | awk -F: '/Tracepoint event/ { lib[$1]++ } END {
    for (l in lib) { printf "  %-16s %d\n", l, lib[l] } }' | sort | column
    block          19	    napi           1	    skb            3
    compaction     3	    net            4	    sock           2
    context_tracking 2	    oom            1	    syscalls       582
    exceptions     2	    pagemap        2	    task           2
    ext4           91	    power          19	    timer          13
    filemap        2	    printk         1	    udp            1
    ftrace         1	    random         6	    vmscan         15
    iommu          7	    ras            3	    vsyscall       1
    irq            5	    raw_syscalls   2	    workqueue      4
    irq_vectors    20	    rcu            1	    writeback      25
    jbd2           16	    regmap         14	    xen            35
    kmem           12	    rpm            4	    xfs            344
    mce            1	    sched          21	    xhci-hcd       9
    migrate        2	    scsi           5
    module         5	    signal         2
[root@docker221 ~]#
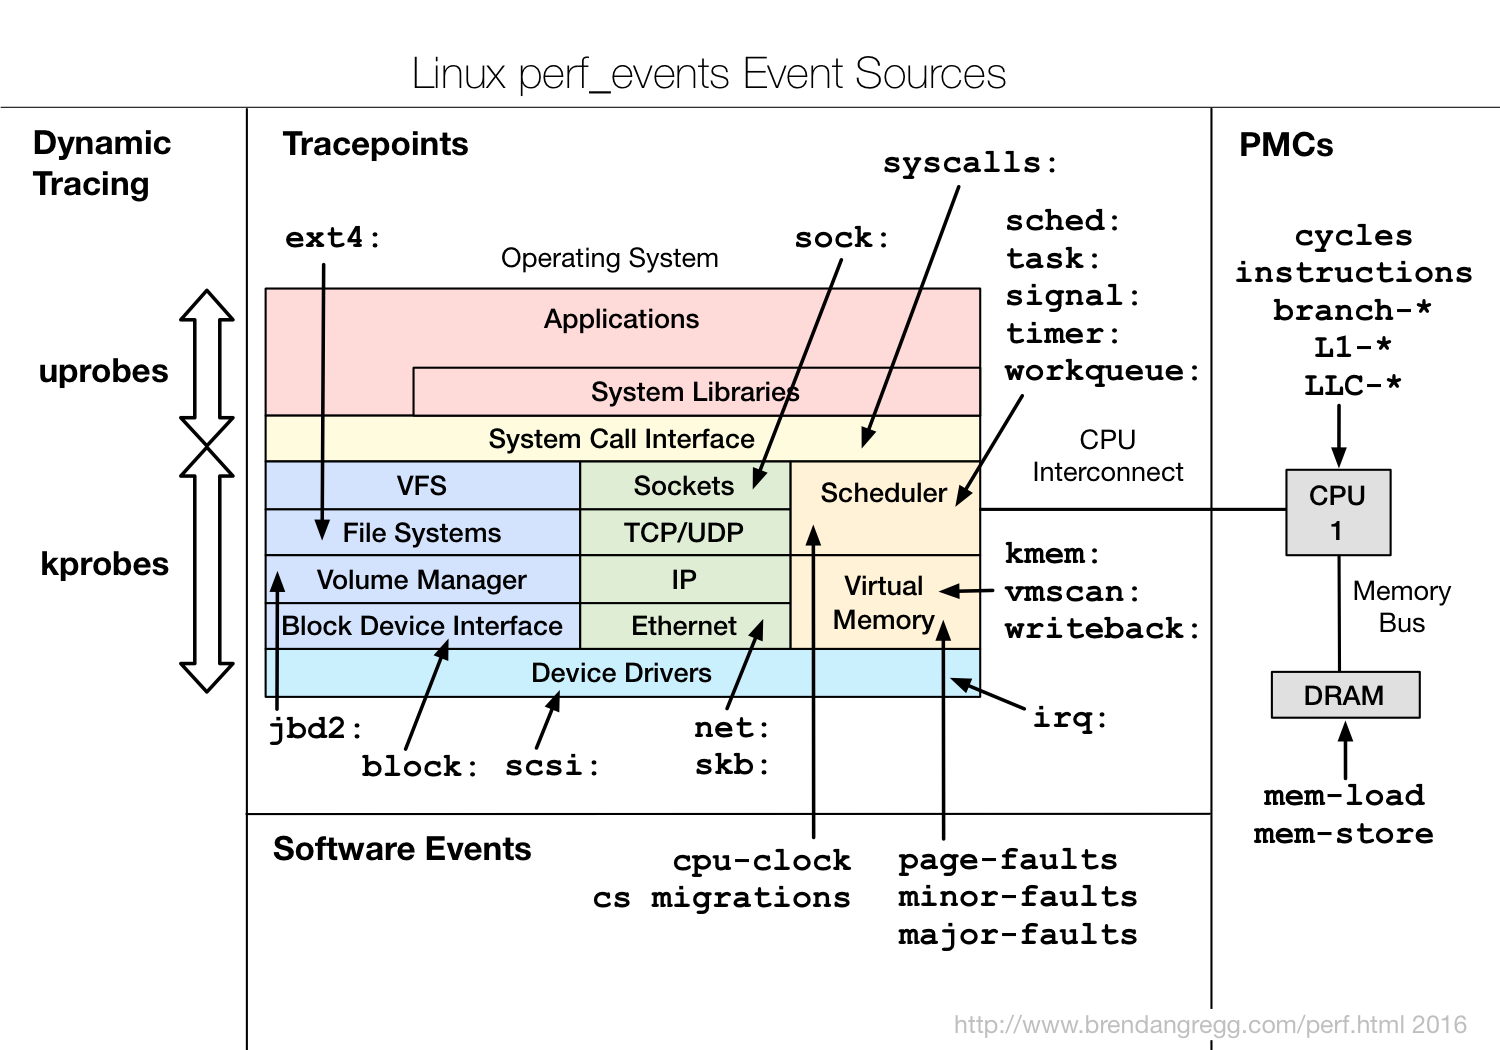
各种类型中包括:
- block: 块设备 I/O
- ext3, ext4: 文件系统操作
- kmem: kernel memory 分配事件
- random: kernel random 生成器事件
- sched: CPU 调度事件
- syscalls: 系统调用进入和退出
- task: task 事件
全局的跟踪可以参考下面的图:
Counting Events
# CPU counter statistics for the specified command:
perf stat command

# Detailed CPU counter statistics (includes extras) for the specified command:
perf stat -d command

# CPU counter statistics for the specified PID, until Ctrl-C:
perf stat -p PID

# CPU counter statistics for the entire system, for 5 seconds:
perf stat -a sleep 5

# Various basic CPU statistics, system wide, for 10 seconds:
perf stat -e cycles,instructions,cache-references,cache-misses,bus-cycles -a sleep 10

# Various CPU level 1 data cache statistics for the specified command:
perf stat -e L1-dcache-loads,L1-dcache-load-misses,L1-dcache-stores command

# Various CPU data TLB statistics for the specified command:
perf stat -e dTLB-loads,dTLB-load-misses,dTLB-prefetch-misses command

# Various CPU last level cache statistics for the specified command:
perf stat -e LLC-loads,LLC-load-misses,LLC-stores,LLC-prefetches command

# Using raw PMC counters, eg, unhalted core cycles:
perf stat -e r003c -a sleep 5

# Count system calls for the specified PID, until Ctrl-C:
perf stat -e 'syscalls:sys_enter_*' -p PID

# Count system calls for the entire system, for 5 seconds:
perf stat -e 'syscalls:sys_enter_*' -a sleep 5

# Count scheduler events for the specified PID, until Ctrl-C:
perf stat -e 'sched:*' -p PID

# Count scheduler events for the specified PID, for 10 seconds:
perf stat -e 'sched:*' -p PID sleep 10

# Count ext4 events for the entire system, for 10 seconds:
perf stat -e 'ext4:*' -a sleep 10

# Count block device I/O events for the entire system, for 10 seconds:
perf stat -e 'block:*' -a sleep 10

# Show system calls by process, refreshing every 2 seconds:
perf top -e raw_syscalls:sys_enter -ns comm
Profiling
# Sample on-CPU functions for the specified command, at 99 Hertz:
perf record -F 99 command

# Sample on-CPU functions for the specified PID, at 99 Hertz, until Ctrl-C:
perf record -F 99 -p PID

# Sample on-CPU functions for the specified PID, at 99 Hertz, for 10 seconds:
perf record -F 99 -p PID sleep 10

# Sample CPU stack traces for the specified PID, at 99 Hertz, for 10 seconds:
perf record -F 99 -p PID -g -- sleep 10

# Sample CPU stack traces for the PID, using dwarf to unwind stacks, at 99 Hertz, for 10 seconds:
perf record -F 99 -p PID -g dwarf sleep 10

# Sample CPU stack traces for the entire system, at 99 Hertz, for 10 seconds:
perf record -F 99 -ag -- sleep 10

# If the previous command didn't work, try forcing perf to use the cpu-clock event:
perf record -F 99 -e cpu-clock -ag -- sleep 10

# Sample CPU stack traces for the entire system, with dwarf stacks, at 99 Hertz, for 10 seconds:
perf record -F 99 -ag dwarf sleep 10

# Sample CPU stack traces, once every 10,000 Level 1 data cache misses, for 5 seconds:
perf record -e L1-dcache-load-misses -c 10000 -ag -- sleep 5

# Sample CPU stack traces, once every 100 last level cache misses, for 5 seconds:
perf record -e LLC-load-misses -c 100 -ag -- sleep 5

# Sample on-CPU kernel instructions, for 5 seconds:
perf record -e cycles:k -a -- sleep 5

# Sample on-CPU user instructions, for 5 seconds:
perf record -e cycles:u -a -- sleep 5

# Sample on-CPU instructions precisely (using PEBS), for 5 seconds:
perf record -e cycles:p -a -- sleep 5

# Perform branch tracing (needs HW support), for 1 second:
perf record -b -a sleep 1
Static Tracing
# Trace new processes, until Ctrl-C:
perf record -e sched:sched_process_exec -a

# Trace all context-switches, until Ctrl-C:
perf record -e context-switches -a

# Trace context-switches via sched tracepoint, until Ctrl-C:
perf record -e sched:sched_switch -a

# Trace all context-switches with stack traces, until Ctrl-C:
perf record -e context-switches -ag

# Trace all context-switches with stack traces, for 10 seconds:
perf record -e context-switches -ag -- sleep 10

# Trace CPU migrations, for 10 seconds:
perf record -e migrations -a -- sleep 10

# Trace all connect()s with stack traces (outbound connections), until Ctrl-C:
perf record -e syscalls:sys_enter_connect -ag

# Trace all accepts()s with stack traces (inbound connections), until Ctrl-C:
perf record -e syscalls:sys_enter_accept* -ag

# Trace all block device (disk I/O) requests with stack traces, until Ctrl-C:
perf record -e block:block_rq_insert -ag

# Trace all block device issues and completions (has timestamps), until Ctrl-C:
perf record -e block:block_rq_issue -e block:block_rq_complete -a

# Trace all block completions, of size at least 100 Kbytes, until Ctrl-C:
perf record -e block:block_rq_complete --filter 'nr_sector > 200'

# Trace all block completions, synchronous writes only, until Ctrl-C:
perf record -e block:block_rq_complete --filter 'rwbs == "WS"'

# Trace all block completions, all types of writes, until Ctrl-C:
perf record -e block:block_rq_complete --filter 'rwbs ~ "*W*"'

# Trace all minor faults (RSS growth) with stack traces, until Ctrl-C:
perf record -e minor-faults -ag

# Trace all page faults with stack traces, until Ctrl-C:
perf record -e page-faults -ag

# Trace all ext4 calls, and write to a non-ext4 location, until Ctrl-C:
perf record -e 'ext4:*' -o /tmp/perf.data -a

# Trace kswapd wakeup events, until Ctrl-C:
perf record -e vmscan:mm_vmscan_wakeup_kswapd -ag
Dynamic Tracing
# Add a tracepoint for the kernel tcp_sendmsg() function entry ("--add" is optional):
perf probe --add tcp_sendmsg

# Remove the tcp_sendmsg() tracepoint (or use "--del"):
perf probe -d tcp_sendmsg

# Add a tracepoint for the kernel tcp_sendmsg() function return:
perf probe 'tcp_sendmsg%return'

# Show available variables for the kernel tcp_sendmsg() function (needs debuginfo):
perf probe -V tcp_sendmsg

# Show available variables for the kernel tcp_sendmsg() function, plus external vars (needs debuginfo):
perf probe -V tcp_sendmsg --externs

# Show available line probes for tcp_sendmsg() (needs debuginfo):
perf probe -L tcp_sendmsg

# Show available variables for tcp_sendmsg() at line number 81 (needs debuginfo):
perf probe -V tcp_sendmsg:81

# Add a tracepoint for tcp_sendmsg(), with three entry argument registers (platform specific):
perf probe 'tcp_sendmsg %ax %dx %cx'

# Add a tracepoint for tcp_sendmsg(), with an alias ("bytes") for the %cx register (platform specific):
perf probe 'tcp_sendmsg bytes=%cx'

# Trace previously created probe when the bytes (alias) variable is greater than 100:
perf record -e probe:tcp_sendmsg --filter 'bytes > 100'

# Add a tracepoint for tcp_sendmsg() return, and capture the return value:
perf probe 'tcp_sendmsg%return $retval'

# Add a tracepoint for tcp_sendmsg(), and "size" entry argument (reliable, but needs debuginfo):
perf probe 'tcp_sendmsg size'

# Add a tracepoint for tcp_sendmsg(), with size and socket state (needs debuginfo):
perf probe 'tcp_sendmsg size sk->__sk_common.skc_state'

# Tell me how on Earth you would do this, but don't actually do it (needs debuginfo):
perf probe -nv 'tcp_sendmsg size sk->__sk_common.skc_state'

# Trace previous probe when size is non-zero, and state is not TCP_ESTABLISHED(1) (needs debuginfo):
perf record -e probe:tcp_sendmsg --filter 'size > 0 && skc_state != 1' -a

# Add a tracepoint for tcp_sendmsg() line 81 with local variable seglen (needs debuginfo):
perf probe 'tcp_sendmsg:81 seglen'

# Add a tracepoint for do_sys_open() with the filename as a string (needs debuginfo):
perf probe 'do_sys_open filename:string'

# Add a tracepoint for myfunc() return, and include the retval as a string:
perf probe 'myfunc%return +0($retval):string'

# Add a tracepoint for the user-level malloc() function from libc:
perf probe -x /lib64/libc.so.6 malloc

# List currently available dynamic probes:
perf probe -l
Reporting
# Show perf.data in an ncurses browser (TUI) if possible:
perf report

# Show perf.data with a column for sample count:
perf report -n

# Show perf.data as a text report, with data coalesced and percentages:
perf report --stdio

# List all raw events from perf.data:
perf script

# List all raw events from perf.data, with customized fields:
perf script -f time,event,trace

# Dump raw contents from perf.data as hex (for debugging):
perf script -D

# Disassemble and annotate instructions with percentages (needs some debuginfo):
perf annotate --stdio
perf 案例研究
案例可以参考我之前的博客:
参考
- http://www.brendangregg.com/perf.html
- https://perf.wiki.kernel.org/index.php/Tutorial
- https://www.ibm.com/developerworks/cn/linux/l-cn-perf1/